Problem Statement
Need to Create Dashboard/report to answer the following questions:
- How is Sales Trend
- what are the Factors effecting sales
- Suggestion to Improve Sales
- Project URL: Excel-project
Project Approch and Solution:
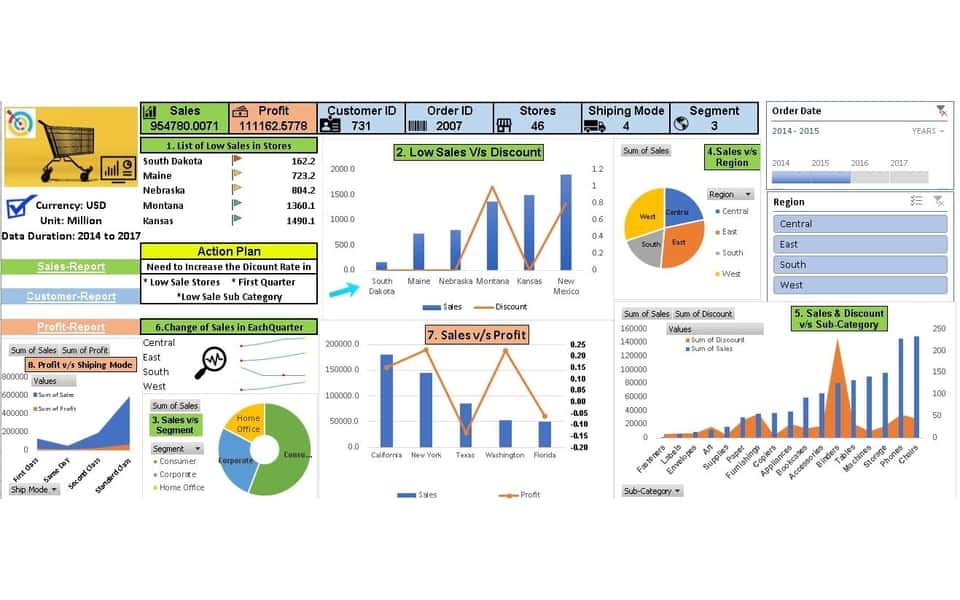
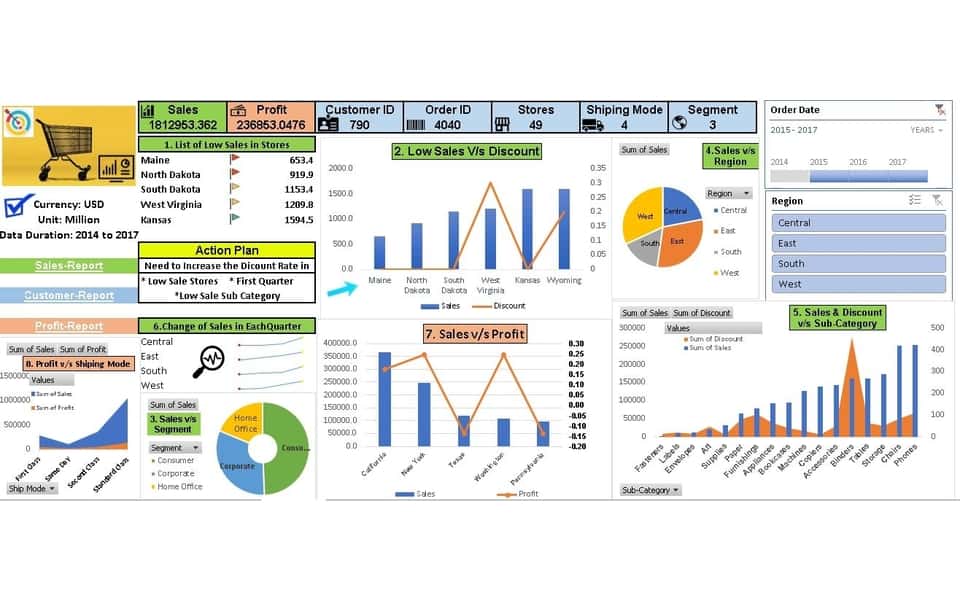
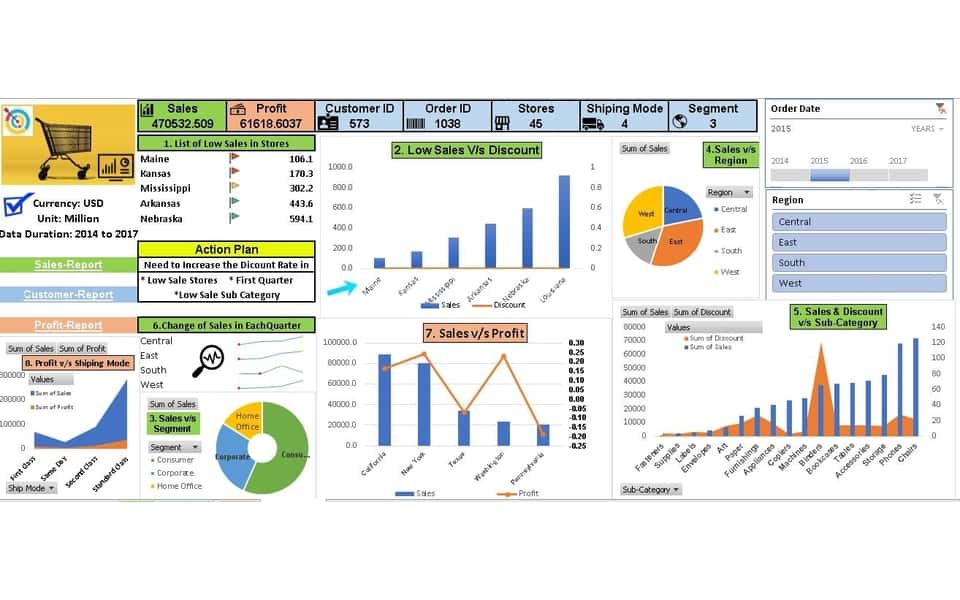
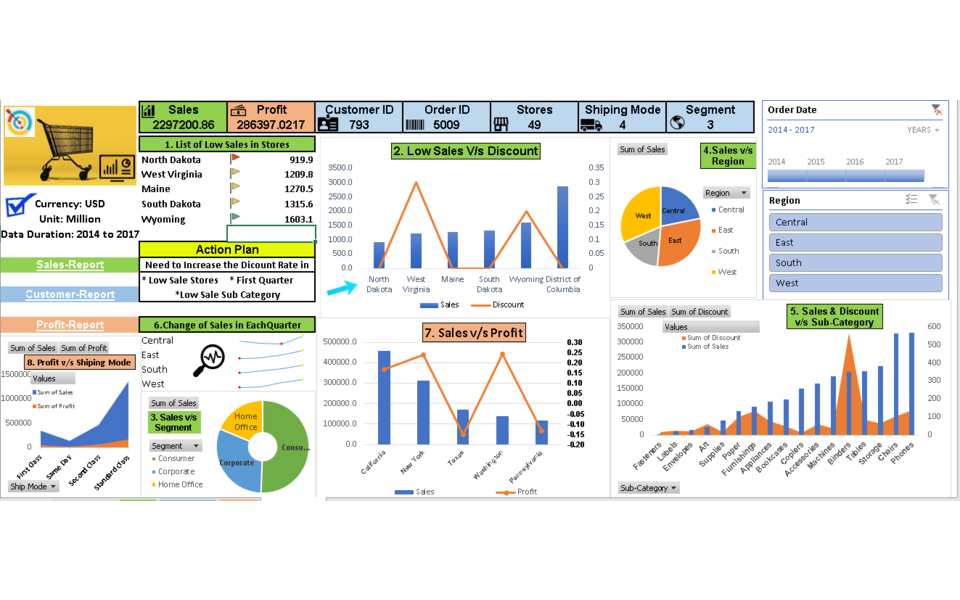
The task was to find the Solution for the Query with the super store data, I initially divided the data to 3 different parts such as Sales,Profit,Customer-report respectively, Using those i Created the trend for the sales with the time series, To make the Dash board more interactive i have used Slicers
The Charts are:
Sales V/s Discount: Combo Chart
Sales V/s Region: Pie Chart
Sales V/s Segment: Donet Chart
Sales V/s Profit: Combo Chart
Sales & Discount V/s Sub-Category: Combo Chart
Suggestion to Improve Sales: Need to increase Discount Rate in Low sale stores , During First Quater , and also to Sub-Category with low sales
Solution:
Check the Complete Solution and Dataset -->>>Here<<<--


